The analysis explores how changes in local public transport (LPT) affect property prices in Rome, correlating changes in €/m² with the measures implemented under the Sustainable Urban Mobility Plan (SUMP) and measuring the effect of new LPT infrastructure in the areas best served.

Share on:
Aims of the Analysis
The analysis compares the TPL Supply Index (total number of journeys available to a thousand inhabitants per urban area) before and after the implementation of the Sustainable Urban Mobility Plan (SUMP) in Rome. The changes made in 15 urban areas of the capital are examined in detail, correlating the trend in property prices with changes in public transport supply. This cross-referenced reading provides an overview of changes in public transport services and their economic impact. For the same areas, sensitivity to public transport is then analysed, i.e. how much the value per square metre is influenced by the variation of a single public transport unit (the greater the sensitivity, the greater the ease with which the price varies).
Indices and Indicators Involved
- LPT Supply Index: measures the public transport service in each urban area in terms of the number of transport journeys (bus, underground, tram) per 1,000 inhabitants.
- LPT Sensitivity Index: The Local Public Transport Sensitivity Index is the result of predictive algorithms and multiple regressions that break down various variables, including journeys, stops and interchanges, to measure their effect on the property market. This complex calculation transforms raw data into a synthetic indicator, capable of revealing the most “responsive” neighbourhoods, where even a small improvement in public transport.
- New LPT Offer: measure of new stops and new transport lines (interventions planned by the PUMS) per 1,000 inhabitants, used to analyse the effects of the PUMS on the ranking.
- Price variation %: Price variation in €/m² calculated as the growth rate compared to the new TPL offer.
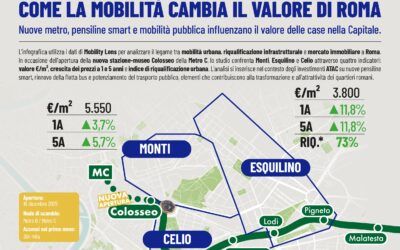
Analysis of the effect of the PUMS on neighbourhoods with more and less public transport provision in Rome
The ranking is based on public transport provision, measured by the index, and is ordered in descending order: the neighbourhoods with the best service are at the top, while those with the poorest service are at the bottom.

Tab1. Top 15 zones per LPT Offer
Looking at the current situation (Table 1), the areas with the highest level of local public transport provision are: Centocelle (1376.2), Celio (906.4), Grottarossa Ovest (635.7), Eur (381.3), Flaminio (289.8), Centro Storico (249.7), Conca d'Oro (170.0), Eroi (168.7), Della Vittoria (118.0), Farnesina (88.0), Laurentino (78.0), Garbatella (63.6), Giustiniana (58.5), Gianicolense (41.8) and Don Bosco (37.0).
Le zone più servite dal trasporto reagiscono positivamente alle nuove infrastrutture, ma la sensibilità dei quartieri alle modifiche dei servizi di trasporto è un fattore determinante. Infatti, quartieri con un alto indice di sensibilità al TPL, come Centocelle (0,47), vedono un significativo aumento dei prezzi immobiliari anche a fronte di modifiche relativamente piccole nella rete di trasporto pubblico. Ad esempio:
- Centocelle recorded a 22.2% increase after the construction of three stops and two tram lines, thanks to its high sensitivity (0.47).
- Celio, despite its low sensitivity index (0.04), still saw a 22.5% increase in prices, indicating that, although less sensitive, the new local public transport service still has a positive impact.
Low sensitivity in some neighbourhoods, on the other hand, means that even substantial interventions have a limited impact. For example:
- Giustiniana, with a sensitivity index of 0.16, recorded a 6.4% increase in prices thanks solely to the addition of a metro stop.
- Laurentino, with a sensitivity index of 0.25, saw a modest increase of 2.0% despite the introduction of new tram stops and lines.
Nei quartieri con un alto indice di sensibilità, la combinazione di metro and tram è particolarmente potente nel generare variazioni significative dei prezzi. I quartieri più sensibili, come Historic Centre and Flaminio, vedono impatti considerevoli:
- The Historic Centre recorded an increase of 21.0% with 28 new metro/tram stops and lines, thanks to its sensitivity of 0.2.
- Flaminio, despite having a lower sensitivity (0.1), saw a 10.5% increase in prices with the addition of one metro line and three tram lines.
Overall, PUMS interventions led to an average price increase of 12.66% in areas with greater public transport provision. Despite the limited effect in less well-served areas, neighbourhoods such as Eroi (+12.7%), Giustiniana (+6.4%) and Don Bosco (+15.1%) still show a positive reaction even to a limited increase in public transport services, suggesting that neighbourhood sensitivity is crucial.
Questo fenomeno evidenzia che non solo la disponibilità di trasporto, ma anche il livello di sensibilità del quartiere alle modifiche dei servizi di trasporto, determina in modo significativo l’efficacia delle nuove infrastrutture e il loro impatto sul valore immobiliare. L’indice di sensibilità aiuta a identificare i quartieri più reattivi alle modifiche nella rete di trasporto pubblico, fornendo informazioni utili per la pianificazione urbana e la valutazione immobiliare.
For a more accurate and in-depth reading of the results obtained from our new project, please refer to the dedicated page.