The analysis, conducted in 15 Italian cities, compares the cost of an annual public transportation season ticket by taking into account local purchasing power, an individual's ability to purchase goods and services in relation to the cost of living in his or her area of residence. Through the Affordability Index, it shows how the nominal price of the 'season ticket does not always reflect its actual economic impact on citizens.

Share on:
Methodology
- Nominal price of annual fare in different Italian cities (2024 data).
- Local purchasing power, a measure that expresses how much of goods and services an individual can purchase with his or her income, taking into account the cost of living where he or she lives. Data were obtained from the Numbeo platform and normalized to an Italian scale, placing the national average index at 100, obtained by dividing the New York scale purchasing power by the Italian average of 90.4.
- Affordability Index of travel tickets, obtained by relating the single-ride ticket price to local purchasing power.
For each city, the percentage deviation between the Affordability Index of travel tickets and the one-way ticket price was also calculated, an indicator of how much the actual cost of the ticket deviates from its apparent value.

Basco&T Consulting elaboration on ACEA data Numbeo
Main Results
Naples: the most expensive annual fare in relative terms
- Annual fare price: €235,00
- Affordability Index: €280,22
- Variation:: +19,2%
Although the nominal price of the season ticket is among the lowest, Naples has the highest percentage increase relative to local purchasing power, making the annual season ticket the most expensive in proportion to residents' economic ability.
Cities with the most expensive annual fare in absolute value
- Padua: nominal price €418.00 → actual index €426.91 (+2.0%)
- Florence: nominal price €378.00 → actual index €407.93 (+8.0%)
- Treviso: nominal price €370.00 → actual index €411.35 (+11.1%)
Padua leads the ranking by nominal cost, but the impact on purchasing power remains small (+2%), compared with larger deviations in cities such as Firenze and Treviso.
Cities in balance between price and purchasing power
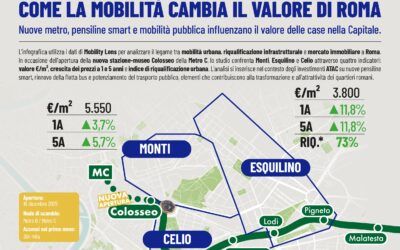
- Rome: nominal price €250.00 → effective index €251.07 (+1%)
- Trieste: nominal price €320.00 → effective index €320.00 (0%)
In Rome and Trieste, the annual season ticket “weighs” substantially as much as one would expect when looking at the list price alone, a sign of a balance between transportation fares and local spending capacity.
The most affordable cities in relative terms
- Catania: nominal price €120.00 → effective index €90.61 (-24%)
- Genova: nominal price €295.00 → actual index €277.46 (-6%)
- Brescia: nominal price €299.00 → actual index €280.93 (-6%)
- In addition, Turin records a savings of 5 percent over the list price.
Catania stands out with the most affordable annual fare in relation to purchasing power, followed by Genoa and Brescia, where the impact on the household budget is significantly lower than the nominal cost.
Conclusion
The analysis shows that mere comparison of nominal fares does not account for the real economic impact of urban transportation subscriptions. By integrating local purchasing power with the Affordability Index, significant differences emerge: at the same nominal price, cities such as Catania and Genova offer more sustainable season tickets for their citizens, while contexts such as Naples put a strain on family budgets despite seemingly low fares. On the other hand, realities with the highest price tags-such as Padua, Florence, and Treviso-can be more or less burdensome depending on average income and local cost of living.
This approach allows us to return a complete picture of the affordability of public transportation service on a territorial basis.
In the previous article, we analyzed theAffordability index of tickets in the LPT, relating them to the purchasing power of each city surveyed.